New article published in Nature: International Journal of Science

New article published in Nature: International Journal of Science

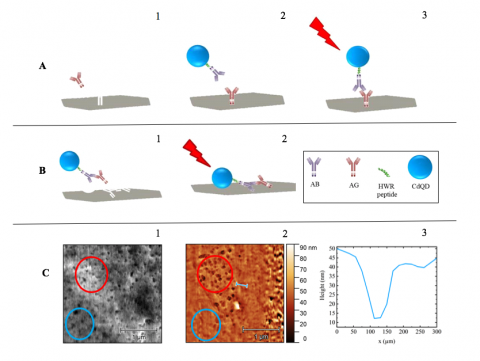
Our new scientific article published in prestigious Nature: International Journal of Science is called: CdS quantum dots-based immunoassay combined with particle imprinted polymer technology and laser ablation ICP-MS as a versatile tool for protein detection.


The combination of molecularly imprinted polymer (MIP) technology with laser ablation inductively coupled plasma mass spectrometry (LA-ICP-MS) is presented with focus on optimization of the LA-ICP-MS parameters such as laser beam diameter, laser beam fluence, and scan speed using CdS quantum dots (QDs) as a template and dopamine as a functional monomer. 


The sample surface was analyzed using SEM LYRA3 (TESCAN, Czech Republic) with integrated AFM LiteScope (NenoVision, Czech Republic). Correlative Probe and Electron Microscopy (CPEM) was used for the surface analysis allowing simultaneous acquisition of SEM and AFM images at the same place in the same coordinate system. This combination of AFM/SEM measurement reveals surface inequalities and obtain true correlative data enabling easier data interpretation with high resolution in all 3 dimensions. 


You can read the full article at the Nature: International Journal of Science.


For more information feel free to contact our application department at application@nenovision.com

In the picture below you can see the surface visualization obtained by Correlative Probe and Electron Microscopy (CPEM). SEM image (1) and AFM image (2) were obtained simultaneously from the same region of the sample. Mainly two regions of the surface are of our interest (red and blue circle). Even though SEM image shows a similar contrast of both regions, AFM imaging clearly confirms differences between the flat surface (blue circle) and wells formed due to the imprinting process (red circle). Therefore, CPEM measurement enables to distinguish the specific features of the sample surface. Profile of one of the wells is shown in graph (3).